
TIME & SALES
Time and sales: every executed trade
Time and sales, also called the tape, is the list of trades that actually happened: when, at what price, how many shares and on which side. In Nasdaq Life it sits under the order book so you can compare resting orders with real executions.
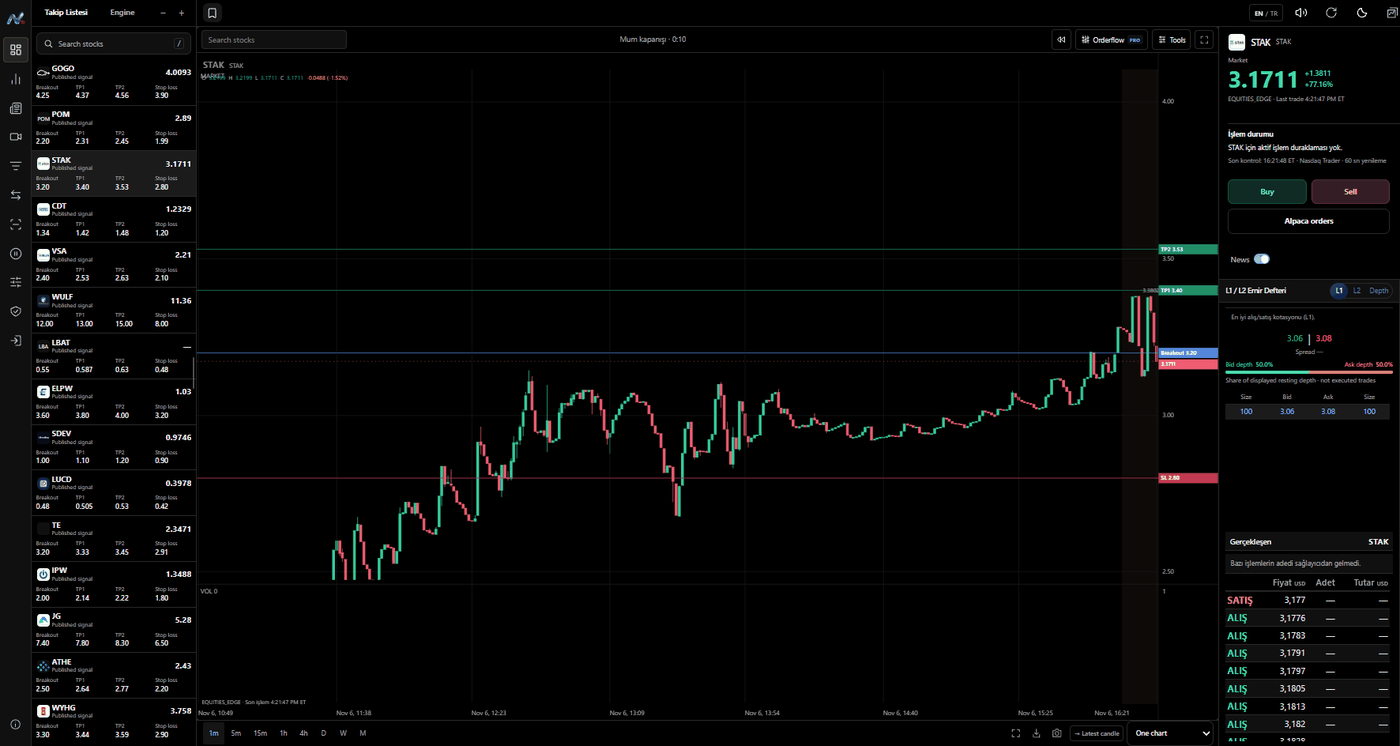
What each row shows
- Side: BUY in green, SELL in red
- Price and size (shares)
- Trade value in USD
- Newest trade first
When the side is known and when it is estimated
If the provider reports the aggressor side it is shown as is. If not, the side is estimated from the bid/ask at that moment or from the tick direction and marked as estimated. When there is no basis, the row says "no side" instead of guessing.
Delayed and missing fields
Some feeds deliver part of their prints with a delay or without a size. The panel labels delayed prints and missing sizes instead of hiding them, so you know what you are looking at.
Why the tape matters
Large prints at the ask after a breakout, or a wall of small sells into a level, often tell more than the candle alone. The same trades also feed the per-candle buy/sell bubbles on the order flow chart.
FAQ
What is time and sales?
A live list of executed trades for one stock with time, price, size and side.
Is time and sales the same as Level 2?
No. Level 2 shows orders waiting to trade; time and sales shows trades that already happened.
Where do the trades come from?
From the licensed data feeds connected to the terminal. The source is shown in the panel.