
STOCK SCANNER
NASDAQ stock scanner for gainers, losers and unusual volume
The scanner lists NASDAQ stocks moving the most right now, side by side: top gainers, top losers and the Engine column with large individual trades. Click any row to open its chart.
Three columns
- Gainers and losers: sorted by percent change, with price, volume and float.
- Engine: live events for unusually large prints, for example a trade worth $5,000 or more, or a single print bigger than a quarter of the stock's average minute volume.
Read volume in context
A volume spike means more when it comes with a real price move and at a meaningful time of day. Pre-market volume is much thinner than regular-session volume, so compare like with like. The scanner shows the session and the time of the last scan.
Float and missing data
Float comes from the provider's shares-float field when it is available. When a number is missing the scanner says "no data" instead of filling it with an estimate.
From scanner to chart
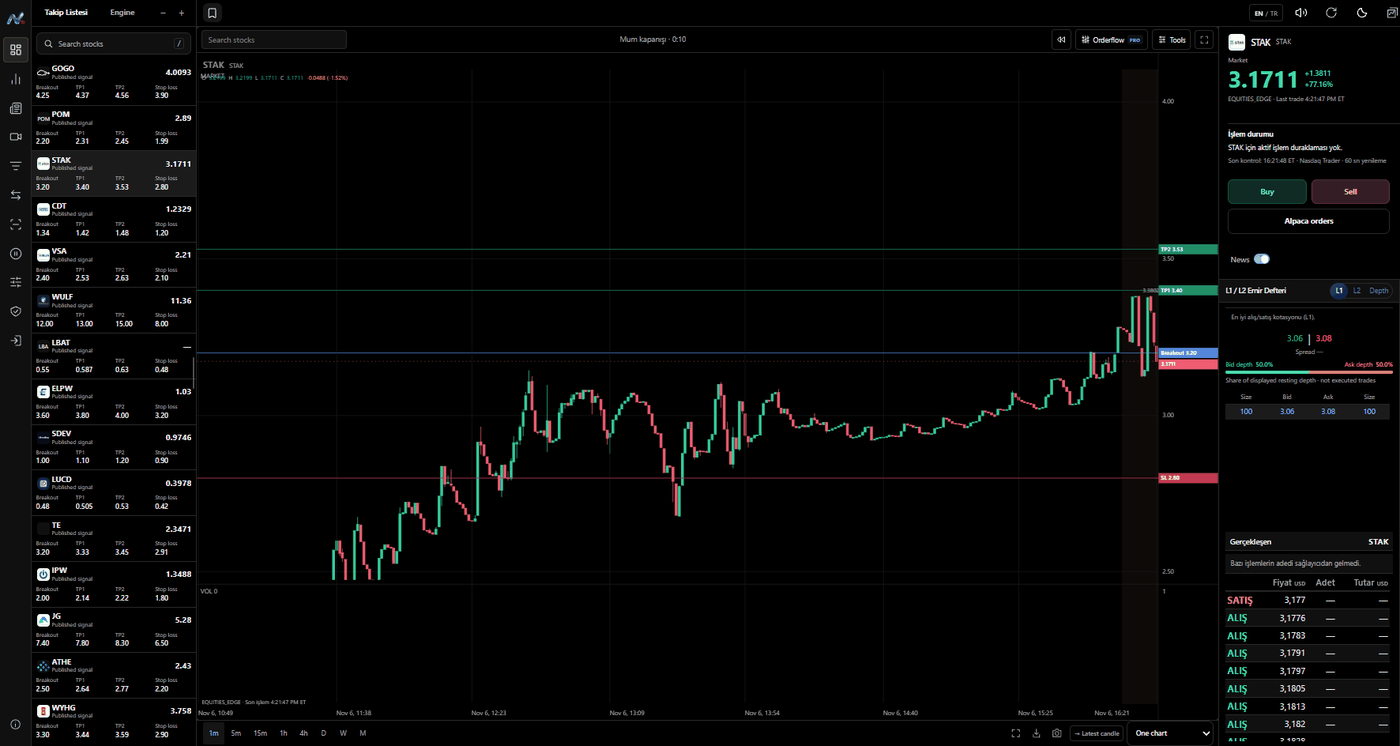
Selecting a symbol opens it in the terminal with the chart, order book, time & sales and order flow, and you can add it to your watchlist with your own breakout, target and stop levels.
FAQ
What does the scanner scan?
The NASDAQ stock universe: gainers and losers by percent change, plus large-trade events from the Engine feed.
How often does it update?
Scanner lists refresh about every minute while the page is open; Engine events stream live.
Can I see it without an account?
The home page demo shows the scanner with sample data.