
ORDER FLOW
Order flow: see buy and sell volume on every candle
A candle shows where price went. Order flow shows who pushed it there. In Nasdaq Life every candle gets a green bubble for buy volume above it and a red bubble for sell volume below it, updated live as trades arrive.
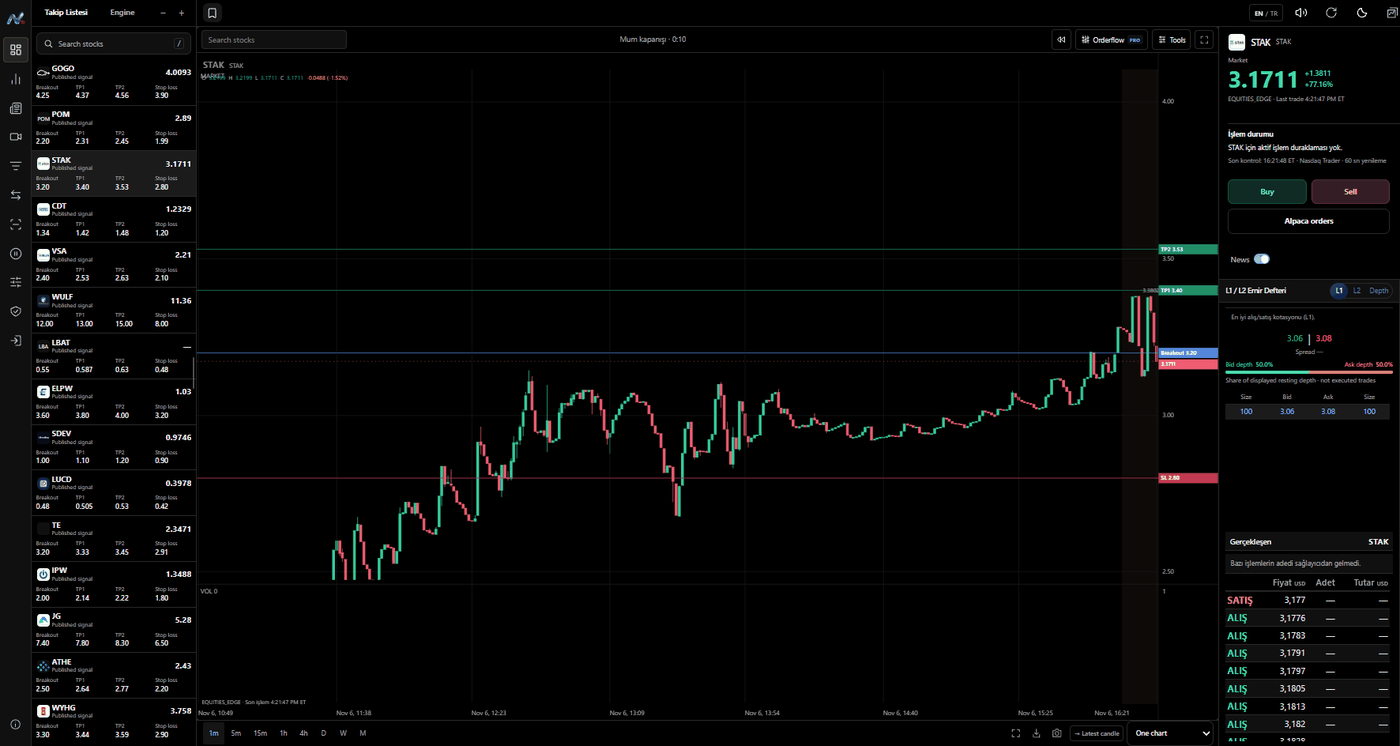
Per-candle buy and sell bubbles
Each executed trade is classified as a buy or a sell and added to the minute it happened in. The green bubble above a candle is the volume that traded as buys, the red bubble below is the volume that traded as sells. Bubble size scales with volume, so the candles where one side dominated stand out immediately. Hover a bubble to see the exact size and trade count.
The same execution reported by two data feeds is counted once, and delayed prints are filed under the minute they actually traded in.
How a trade is classified
- If the provider reports the aggressor side, that side is used.
- Otherwise the trade is compared with the bid and ask at that moment: at or above the ask is a buy, at or below the bid is a sell.
- Otherwise the tick rule is used (uptick = buy, downtick = sell).
- If none of these apply, the volume stays unknown and is not forced into a side.
Other order flow tools
- Big trades: bubbles for the largest individual executions
- Volume profile with POC, VAH and VAL
- Bid × ask imbalance and footprint cells (delta, volume, trade count)
- Cumulative delta (CVD)
- VWAP and TWAP (daily, weekly, monthly)
Limits worth knowing
Order flow is built from the trades the terminal has received. Candles from before a stock was being recorded show no bubble rather than an estimate. Side classification is an estimate when the provider does not report it, which is why it is labeled.
FAQ
What is order flow in stocks?
Order flow is the stream of executed buy and sell orders. Looking at it shows whether buyers or sellers were more aggressive during a move.
Does it work live?
Yes. Bubbles on the current candle grow as new trades arrive, without reloading the chart.
Which stocks are covered?
NASDAQ-listed stocks in the terminal. Coverage follows the connected data feeds.